Mid-Year Mixed Signals
Expect the unexpected is probably the best way to describe the first half of this year. If someone were to say six months ago that the Fed funds rate would go to 5.25%, we would see some of the largest regional banks in history going into conservatorship, and the U.S. government would nearly experience a technical default, many investors would likely have guessed that most major indices would be down this year. Instead, we have seen double-digit returns for both the S&P 500 and NASDAQ as both indices have rallied off their 2022 year-end lows.
Nonfarm payroll figures have beaten expectations five out of the last six months and unemployment has continued to stay below historical averages even as tech-related layoffs have increased during the year. Given the mixed signals of relatively strong economic data while earnings have dropped considerably, it has become increasingly difficult to determine what stage of the economic cycle we are in.
Equity Markets:
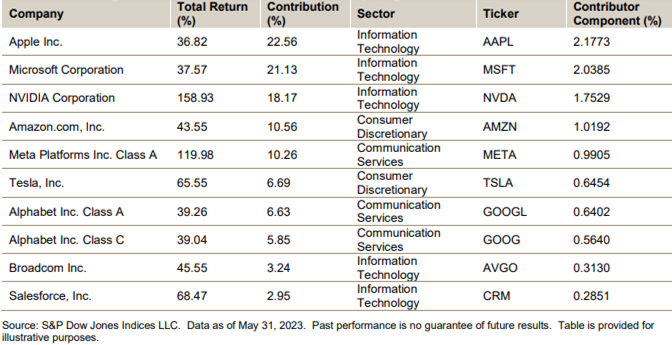
Growth has taken back its throne over value as tech stocks bounce off a miserable showing in 2022. Mid-year figures show a nearly ~9% gap between the S&P 500 growth and value. The interesting part about this rally is that most of the performance within the S&P 500 has been from just seven mega-cap tech companies: Apple, Alphabet, Meta, Microsoft, NVIDIA, Amazon, and Tesla. These stocks have collectively kept the S&P 500 in positive territory, and 6 out of 7 names are in the top 7 market caps of the index. Tesla is the only one that is not, (ranked 9th). This further denotes that passive flows make up most of the market and could be obscuring price discovery as markets rallied on softer earnings. The chart below highlights how each of these stocks contributed to the S&P 500 performance YTD as of 5/31.
Fixed Income Markets:
After falling -13.02% in 2022, the Bloomberg US Aggregate Bond index has returned +2.59% as of 5/31/23. The U.S. treasury yield curve has remained inverted as the Federal Reserve has continued to increase the Federal Funds Rate. This sentiment has been echoed for some time now, but the 2-year to 10-year yield curve inversion has accurately forecasted a recession anywhere from 6 to 24 months out since 19551 with only one instance in 2018 where it wasn’t an accurate signal. The current 2/10’s yield curve inversion began on July 7th, 2022. Only time will tell if this indicator continues to be accurate once again.
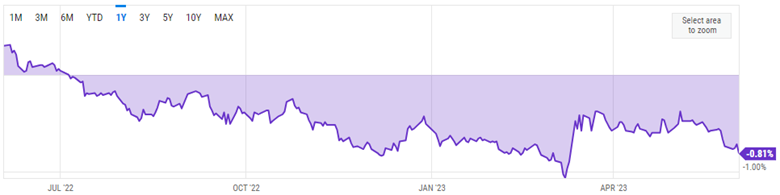
Source: currentmarketvaluation.com
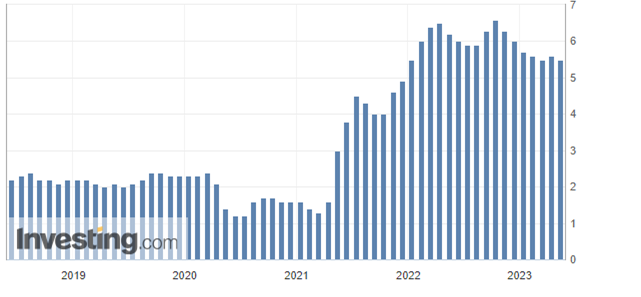
Inflation:
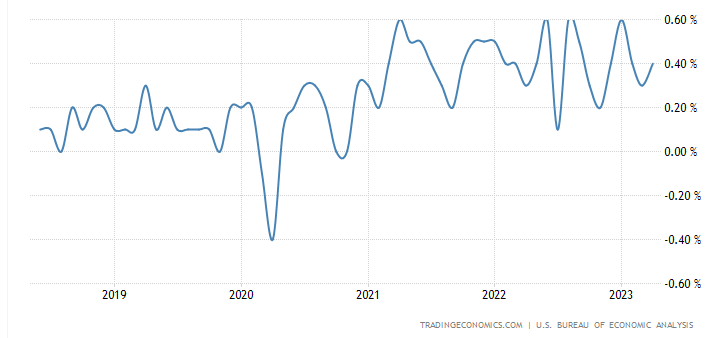
Inflation has dropped from its peak but remains sticky as Personal Consumption Expenditures, also known as PCE, remain elevated with April’s reading coming in at 0.4%, showing an increase from 0.1% in March.
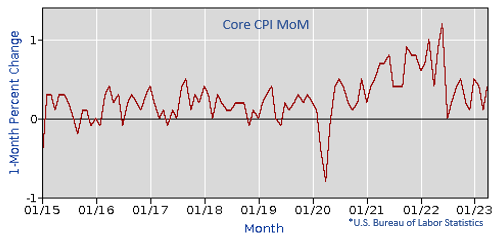
Core CPI has also remained sticky, as energy kicked backed up in the May report along with used car sales. Shelter has moderated but had a 0.4% increase in April. The Core CPI trend has been moving downward but remains well above the Federal Reserve’s 2% target at 5.5%.
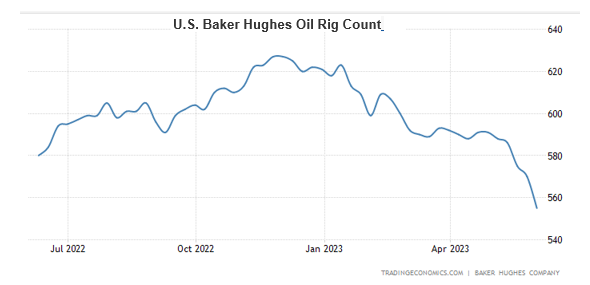
Oil & Gas Markets:
After a stellar 2022 performance, energy has been slow out of the gate in 2023. The S&P energy sector was down -12.89% at the mid-year point which could simply be a mean-reversion move after multiple standard deviations of upside performance from last year. Despite the negative performance in energy equities, there are many tailwinds that could reaffirm oil & gas. The Baker Hughes Rig Count has seen a steep decline this year, with the lowest U.S. Oil rig count since September 20212. OPEC+ has been cutting oil production and has recently agreed to extend cuts through the end of 2024 by more than 1 million barrels per day, (the current daily average is roughly ~85 million barrels per day). The U.S. continues to dip into its strategic oil reserves hitting new reserve lows. Lastly, there is still lingering travel fever from individuals who haven’t had a chance in the last few years. These tailwinds could be indicators to show that oil may experience a rally this summer and possibly into the year-end.
The Federal Reserve & Treasury:
Congress finally passed a deal suspending the debt limit through 2024 and the Federal Reserve will now be looking to issue roughly $1.4 trillion in treasury debt to fund its cash reserves, which hit a low of roughly ~$37 billion and got uncomfortably close to a technical default. On the surface, more government spending sounds inflationary, but this could have the opposite effect as $1.4 trillion dollars of gross liquidity will be drained from the system and may push short-term rates higher as well. Some investment strategists think that roughly $400 billion could be raised in June and cumulatively $800 billion by the end of August.
Positioning Moving Forward:
The path forward remains murky. While the debt ceiling deal and stabilization of regional bank stock prices have lowered the immediate threat of recession to some degree, we find it likely that the economy will slip into a mild recession in the later stages of this year. The inverted yield curve remains concerning and the lagging impact of Fed tightening will likely prove to be a headwind to economic growth. Banking liquidity concerns continue to be a tail risk, especially as Treasury balance sheet funding ramps up, thus pulling liquidity from bank balance sheets from increases in Treasury purchases.
The equity rally, although encouraging, seems to be up against a difficult backdrop for the rest of the year. Positive news on the AI front could help push some tech stocks higher, but overall, it seems that the sector could see some softening in the second half of the year. Meanwhile, underperforming sectors such as energy, industrials, and (to a lesser degree) consumer discretionary as well as small/midcap equities could be poised for a move to the upside. Leadership rotation in the second half of the year would be positive overall. While a prudently diversified equity portfolio has underperformed this year, our view is that chasing momentum (mega-cap technology and communications services) at this time is not advisable.
Within fixed income, a barbell approach between short-term treasuries and longer-duration credit should position investors well for an eventual normalization of the yield curve. The higher-than-normal yields on the very short end of the curve are extremely enticing, but there are relative value opportunities further out on the curve, particularly in municipal and corporate credit.
Exposure to alternatives, more specifically within private credit, could also help with portfolio diversification as this area could capture some outsized returns as these funds become larger liquidity providers in the market. Outside of private credit, we believe that private equity and real estate strategies that currently have cash available to invest will begin to see attractive opportunities as valuations come down in many areas.
Overall, given all the mixed market signals today, it’s critical to keep a well-diversified portfolio and remain unemotional around the ever-evolving headline risks. Much will depend on upcoming inflation readings and resulting Fed policy implications. As investors gain clarity on economic damage / the threat of recession and the prospects for a pause in rate hikes, fundamentals should lead risk assets higher and yields lower over the next 12 months.
As always, please do not hesitate to reach out with any questions or for further discussion. Thanks for taking a look!
|
Josh L. Galatzan, CIMA® |
Kirk Price |
|
Chris J. Popso |
Brian J. Noonan, CEPA |
|
Meagan Moll, CIMA®, CFP®, CPWA® |
The content of this publication should not be regarded as a complete analysis of the subjects discussed. All expressions of opinion reflect the judgment of the authors on the date of publication and are subject to change. There is no representation or warranty as to the current accuracy, reliability or completeness of, nor liability for, decisions based on such information and it should not be relied on as such. Information presented should not be construed as personalized investment advice or as an offer to buy or sell, or a solicitation of any offer to buy or sell the securities mentioned. Content is derived from sources deemed to be reliable. Any projections, market outlooks, or estimates are based upon certain assumptions and should not be construed as indicative of actual events that will occur.
Different types of investments involve varying degrees of risk, and there can be no assurance that any specific investment or strategy will be suitable or profitable for an investor’s portfolio. All investments have the potential for profit or loss. Past performance does not ensure future investment success.
Index returns do not represent the performance of Meridian Wealth Advisors or any of its advisory clients. Historical performance results for investment indexes and/or categories, generally do not reflect the deduction of transaction and/or custodial charges or the deduction of an investment advisory fee, the incurrence of which would have the effect of decreasing historical performance results. There can be no assurances that an investor’s portfolio will match or outperform any particular benchmark.
Meridian Wealth Advisors, LLC is registered as an investment adviser with the SEC and only transacts business in states where it is properly registered or is excluded or exempted from registration requirements. SEC registration does not constitute an endorsement of the firm by the Commission nor does it indicate that the adviser has attained a particular level of skill or ability.