May Economic & Market Recap: Same Song Different Verse?
May Economic & Market Recap: Same Song Different Verse?
May 20th, 2016
Wild swings in equity markets and commodities, extremely low interest rates and economic uncertainty have characterized financial market’s start to 2016. Sound familiar? It would indeed seem that we are singing a different verse to the same song as last year.
Economic data in March and April came in mixed, possibly reflecting seasonal adjustment issues related to the early Easter this year. This continues the anemic growth trend we have become accustomed to in this recovery, which has been the slowest in the post-war era. GDP growth over the last seven years has averaged just over 2%, which also happens to be the consensus estimate for 2016.
- The advanced estimate first quarter Real GDP came in at .50% (vs. +1.4% in 4Q15), up from this time last year.
- Consumer spending came in somewhat better than expected at +1.9%, although down from a year ago.
- Meanwhile, inflation adjusted disposable income rose 3.1%, indicating support for the consumer heading into the coming months.
- Business fixed investment fell sharply (-5.9%) with three quarters of the decline being attributed to a drop in mining structures (which included oil and gas drilling).
- Manufacturing around the globe was weaker than expected, while U.S. ISM figures remained expansionary.
- U.S. Productivity gains continue to be weak, increasing at an annualized pace of 1%, compared to a post-war recovery average of 2.4%.
- Auto sales missed estimates badly, however the advanced estimates for May are looking quite strong, which is a good sign for consumption numbers moving forward.
To no one’s surprise, the Federal Open Market Committee (FOMC) left rates unchanged at their most recent meeting, maintaining their “wait and see”, data dependent stance. It seems that policy makers still expect growth to pick up, and to gradually normalize monetary policy as long as U.S. economic growth remains stable. While the FOMC removed references to “global economic and financial developments” posing risks, it appears they continue to weigh the impact of further tightening moves in conjunction with quantitative easing and negative interest rate policies abroad. Markets initially reacted positively to the “no change” announcement, before selling off into the end of the month.
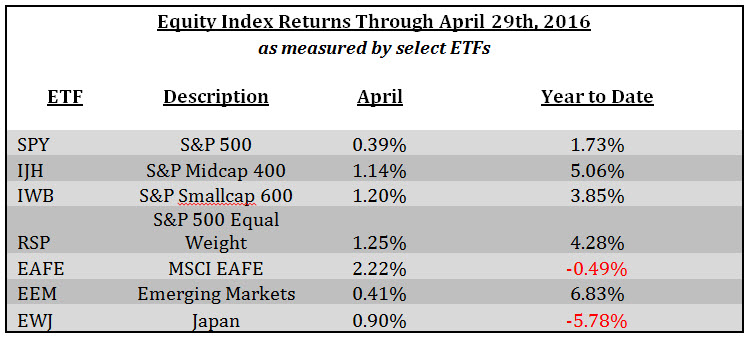
Domestic equity markets, as measured by the S&P 500, have been range bound between 1,810 and 2,135 for the last 18 months. After selling off in January and February, the S&P surged into April, coming within striking distance of a new all-time high before losing steam into the end of the month. Outside of the US, the developed international indices have traded mostly sideways this year. Emerging markets have surged on renewed strength in commodities while Japan has faltered despite being a top performer last year.
The list of contributors to the range bound market we find ourselves in is not a short one. Earnings have been weak, although better than expected, keeping valuations on US equities full. The most recent equity market peak (April 20th) left the S&P trading at a PE multiple of 18.1, on the high end of the 15.5-18.5 range we have seen since the Fed ended Quantitative Easing (QE) in late 2014. We find it difficult to imagine much multiple expansion in the near term, given the lack of earnings growth and fundamental headwinds both at home and abroad. Swings in both the price of crude oil and the U.S. dollar have had a direct impact on the direction of the market. The recovery from this year’s lows correlated strongly to the recovery in crude prices and weakness in the dollar, correlations which are likely to remain strong in the near term. Divergent monetary policy around the world and China’s slowing economy also remain key influencers on equity prices.
Geopolitical concerns remain elevated, perhaps the most important of which is the coming U.S. presidential election. As we have made our way through the nomination process, we find ourselves choosing between two candidates with very different backgrounds and policy stances. The uncertainty surrounding this election is certainly having an influence on equity markets; and as you have all heard me say before, the market hates nothing more than it hates uncertainty. I think it is fair to say that investors currently view a Clinton presidency as bringing more predictable policies to the White House (and therefore less uncertainty). A recent analysis we read noted a very strong correlation between the S&P 500 and the likelihood of the Democratic candidate winning the presidential election, as tracked by the Iowa Electronic Markets. Voters from both parties have clearly voiced a desire for change in Washington, as evidenced by Mr. Trump’s runaway from “establishment” Republican candidates and Bernie Sanders’ surprising show against Mrs. Clinton. How next year’s election plays out will not only be interesting to watch as a voter, but will certainly have significant ramifications to investors around the globe.
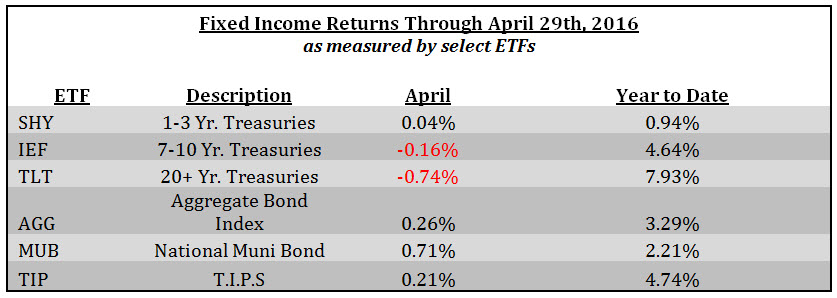
While equities in general have delivered lackluster results in 2016, fixed income returns have been quite strong as rates have continued to move down over the last year. The 10 year treasury closed on May 13th at a yield of 1.71%, down from 2.23% a year ago. The 30 year treasury has followed suit, closing on May 13th at a yield of 2.55%, down from 3.03% a year ago. Similar moves have taken place in municipal bonds and to a lesser extent, investment grade corporates.
The spread between 2-year and 10-year, as well as between the 2-year and 30-year, have narrowed to their lowest levels since the Great Recession, resulting in what is known as a flattening of the yield curve. A flattening yield curve is often a sign that fixed income investors foresee a period of slowing economic growth in the near term. Monitoring the yield curve for inversion is key, as an inverted yield curve is often a precursor to recessionary periods. So why have rates remained low, (i.e. prices higher), and moved even lower on fixed income after the Fed raised rates in December? Although it is difficult to say with certainty, it appears that the persistently low inflation rate domestically (below the Fed’s 2% target) and abroad is leading investors to discount the likelihood of significant rate increases through the remainder of the year. Additionally, with several foreign central banks (i.e. Europe, Japan etc.) continuing down the path of increasingly accommodative monetary policy (including quantitative easing and negative interest rate policies), and an aging global population, investor demand for US Treasuries remains very high.
So where does this leave us heading into the summer months? Many pundits are noting the persistently slow pace of the recovery, even with the assistance of unprecedented monetary stimulus, and calling for recession. While we do not debate that the pace of GDP growth has been frustratingly low, we do not agree that we are staring down the barrel of a recession. We view the economic data as mixed, and supportive of continued modest GDP growth this year. We find it especially interesting to note that while US Real GDP growth has stubbornly hovered right at 2%, just above “stall speed” and US Productivity has annualized an anemic 1%, the real wage rate has been climbing at a pace of .86% per year. This represents a 7.5% growth rate since the end of the last recovery, and one of the strongest readings during any recovery since the 1960s. Real wage rates have rarely risen without a corresponding rise in productivity. Real wage rate growth coupled with a lack of productivity growth would imply that companies are paying up for a resource that is delivering subpar performance. This leaves many economists scratching their heads, and asking if real wages are overstated, or if productivity is understated; a fair question that is impossible to answer with certainty. With inflation expectations hovering just above 1.5% and well below the Fed’s target of 2%, this is up from a post-recession low of just .94%, even while the yield curve has been flattening. In other words, 5 year inflation expectations are up 63%.
While US equity markets seem fairly valued given current consensus earnings, we see evidence of a return to earnings growth in the second half of the year, which would be very supportive of equities and perhaps lay the ground work for a push through the lid that has been on the S&P 500 at 2,135. We are also seeing improved breadth in the market, with stronger returns coming from small / mid cap stocks as well as large caps at the lower end of the capitalization scale. Last year investors were frustrated and dismayed by the concentration of returns from the mega cap names, and we view the broader participation as a positive for diversified portfolios moving forward. Additionally, we continue to view current monetary policy conditions around the world as supportive of risk assets. The firming in commodity prices and softening of the dollar should also bode well for US equities in particular. Lastly, we continue to see signs of improvement out of Europe, signaling that the ECB’s QE programs are working, despite less than stellar headlines.
As we head into the historically weak season of May-November, we remain cautiously optimistic that the current economic recovery and secular uptrend in equities is not yet coming to a close. We believe rates are likely to remain low, and perhaps even move lower before reversing. Our eyes remain focused on the direction of the coming presidential election, changes in monetary policy from central banks around the world, and hopefully, a resumption in earnings growth in the second half of the year.
As always, please do not hesitate to contact me directly with questions or to discuss any of the above information further.
Best,
Josh L. Galatzan, CIMA®
Meridian Wealth Advisors
Managing Director & Founder
The content of this publication should not be regarded as a complete analysis of the subjects discussed. All expressions of opinion reflect the judgment of the authors on the date of publication and are subject to change. Information presented should not be construed as personalized investment advice or as an offer to buy or sell, or a solicitation of any offer to buy or sell the securities mentioned. Content is derived from sources deemed to be reliable.
Different types of investments involve varying degrees of risk, and there can be no assurance that any specific investment or strategy will be suitable or profitable for an investor’s portfolio. All investments have the potential for profit or loss. Past performance does not ensure future investment success.
Index returns do not represent the performance of Meridian Wealth Advisors or any of its advisory clients. Historical performance results for investment indexes and/or categories, generally do not reflect the deduction of transaction and/or custodial charges or the deduction of an investment advisory fee, the incurrence of which would have the effect of decreasing historical performance results. There can be no assurances that an investor’s portfolio will match or outperform any particular benchmark.
Meridian Wealth Advisors, LLC is registered as an investment adviser with the SEC and only transacts business in states where it is properly registered, or is excluded or exempted from registration requirements. SEC registration does not constitute an endorsement of the firm by the Commission nor does it indicate that the adviser has attained a particular level of skill or ability.