August 2016 Market Commentary
August 2016 Market Commentary
September 12th, 2016
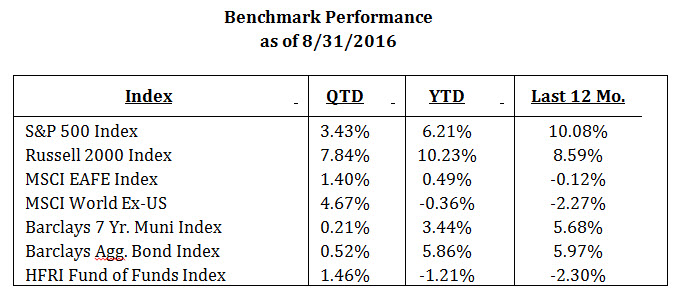
As the summer comes to a close, college football season kicks off and we move into what is likely to be an interesting season for global markets and the global economy. After reaching new all-time highs on the S&P 500 index, U.S. Equities continue to consolidate in tight range with very low volatility by historical standards. During the month of August, every daily percentage move was less than 1%, with light and contracting volume throughout the month. As you can see in the chart below, U.S. Equities continue to lead global markets in terms of performance, with small and mid-cap stocks out performing large cap stocks.
Within U.S. Equites we have seen a significant shift in market leadership as compared to last year. Recall that in 2015 leadership was focused in a very small percentage of the largest capitalization U.S. stocks led by the likes of Amazon, Google, Disney etc. Small and mid-cap stocks significantly underperformed, as did international developed and emerging markets. This year, however, breadth has returned to the markets and have seen a shift in leadership to small and mid-cap stocks and, within the large cap space, Consumer Staples, Telecom, Energy and Utilities as investors continue to search for yield in an extremely low interest rate environment. Within international equities, developed markets rallied in the third quarter off the “Brexit lows”, but total returns year to date remain lackluster at best.
Outside of equities, bond yields have continued to hover near all-time lows, although off the lowest levels seen immediately after the Brexit announcement. The corresponding price appreciation has led to an impressive total return again this year in most bond markets, with the Barclays Aggregate bond index up 5.86% as of August 31st.
On the economic front, the U.S. continues to be “the best house on the block”, with the pattern of stubbornly low growth continuing. Q2 GDP estimates were revised to a 1.2% annual clip, with domestic demand rising 3%. Consumer spending, which makes up 70% of the US economy, has been trending at a relatively healthy pace. However, the latest jobs report came in lighter than expected with average hourly earnings growth disappointing once again and ISM manufacturing data contracting. This most recent data has once again called into question when the Fed may raise rates again. Heading into the report the odds of a September rate hike had spiked from 18% to 42%, but fell sharply back to 30% immediately following the announcement. With recent comments from Fed officials pointing towards a likely hike in September or December, the question now becomes whether or not they remain data dependent, or if they overlook the recent weak data and move forward with raising rates sooner rather than later.
One thing is certain, investor activity will be significantly influenced by both the content and the tone of the Fed’s September 21st meeting minutes. Should they surprise us with a September rate increase, equity markets will likely pull back as investors reconsider what the move means for economy and the investment landscape.
Obviously, the upcoming presidential election will be impactful on at least the short term returns in financial assets. Currently Secretary Clinton appears to be on a glide path that will end in the Oval Office, with Mr. Trump struggling to gain ground in several key swing states. This has contributed to the recent calm in the markets in our opinion, as it is our belief that investors see a Clinton presidency as having a more predictable impact than a Trump presidency. Were Mr. Trump to turn the momentum and come through with a surprise victory in November, we find it likely that risk assets would pull back in light of the relative uncertainty that this scenario brings to the economy and the markets.
The U.S. equity bull market is now 90 months old, one of the longest on record, and has delivered 17% annual returns from the March 2009 lows. By most traditional measures, valuation have become stretched and many pundits are calling for the end of this bull cycle. For example, the PE ratio on the S&P 500 recently peaked at 20.4 times trailing earnings, above the post WWII average by nearly 30%. What is needed to continue the uptrend? In short, earnings growth. Short term market movements are a result of many factors, icluding earnings, economic conditions, investor sentiment, fear and greed. However, over long term periods equity market returns are highly correlated to earnings and we fundamentally believe that earnings and earnings growth are the most important factors in analyzing equity market valuations. In the post war era, the S&P 500 has averaged a total return of 10.7% (price appreciation plus dividends), while annualized earning growth has averaged around 7%. This year, earnings expectations on the S&P 500 has hovered around $117.55 (or .7% earnings growth), while 2017 bottom-up earnings estimates are currently $133.26. While we feel the consensus estimates may be on the aggressive side, there is a clear trend that analysts expect earnings growth to resume in the second half of 2016 / first half of 2017. Should this indeed be the case, we find it plausible, and probable, for equity markets to continue to grind higher over the next 12-18 months.
Meanwhile, the main benchmark for international developed markets, the MSCI EAFE Index, is little changed over the last decade and is in its fifth year of underperformance versus US Equities and Fixed Income. Frustrated by the lack of return, investors have been jumping ship, with every month of 2016 showing negative flows from European funds. However, the signs of an improving economic and earnings picture in Europe are developing which, coupled with aggressive monetary policy from the European Central Bank, gives us hope the developed international markets are in store for improved performance in the next few years.
As previously mentioned, global bond yields have remained extremely low, and in many cases have moved lower. A combination of easy global monetary policy (in many cases aggressive stimulus) and investor demand for yield has pressured rates around the world and will likely continue to do so. Even if the Fed were to raise rates in 2016, we question how significantly longer term rates might be impacted. At the end of August, the ten-year U.S. Treasury traded at a yield of 1.59%, while Germany’s ten-year sovereign debt traded a yield of -.07% and Japan at -.06%. Yes, you read that correctly, two of the world’s most advanced economies have ten-year sovereign debt trading at negative yields. U.S. debt is not only among the safest in the world, but also among the highest yielding. Therefore, while it is unlikely that yields move much lower than the levels we saw immediately after the Brexit announcement (around 1.36% on the ten-year treasury), it is also unlikely that they move substantially higher in the near term. Currently the yield curve, or spread between the Fed Funds rate and 10-Year US Treasury, remains positive. We will monitor this closely, as an inverted yield curve has almost always preceded recessions.
As we move towards the fourth quarter of 2016, we see a number of market influencing factors on the horizon. The upcoming Fed meeting, the presidential election, earnings season and the initiation of Brexit negotiations are at the forefront. Within equities we continue to favor domestic exposure, but stand against the crowd by not reducing our international exposure. Within Fixed Income, we continue to favor high quality municipal and intermediate corporate exposure. As always, please do not hesitate to reach out directly to discuss any of the above mentioned information or the impact on your portfolio’s positioning.
Best,
Josh L. Galatzan, CIMA®
Meridian Wealth Advisors
Managing Director & Founder
The content of this publication should not be regarded as a complete analysis of the subjects discussed. All expressions of opinion reflect the judgment of the authors on the date of publication and are subject to change. Information presented should not be construed as personalized investment advice or as an offer to buy or sell, or a solicitation of any offer to buy or sell the securities mentioned. Content is derived from sources deemed to be reliable.
Different types of investments involve varying degrees of risk, and there can be no assurance that any specific investment or strategy will be suitable or profitable for an investor’s portfolio. All investments have the potential for profit or loss. Past performance does not ensure future investment success.
Index returns do not represent the performance of Meridian Wealth Advisors or any of its advisory clients. Historical performance results for investment indexes and/or categories, generally do not reflect the deduction of transaction and/or custodial charges or the deduction of an investment advisory fee, the incurrence of which would have the effect of decreasing historical performance results. There can be no assurances that an investor’s portfolio will match or outperform any particular benchmark.
Meridian Wealth Advisors, LLC is registered as an investment adviser with the SEC and only transacts business in states where it is properly registered, or is excluded or exempted from registration requirements. SEC registration does not constitute an endorsement of the firm by the Commission nor does it indicate that the adviser has attained a particular level of skill or ability.